How is the USDA so High on Soybean Yield?
9/12/2017
Ted Seifried
Zaner Ag Hedge
TRADING COMMODITY FUTURES AND OPTIONS INVOLVES SUBSTANTIAL RISK OF LOSS ANDMAY NOT BE SUITABLE FOR ALL INVESTORS. YOU SHOULD CAREFULLY CONSIDER WHETHER TRADING IS SUITABLE FOR YOU IN LIGHT OF YOUR CIRCUMSTANCES, KNOWLEDGE AND FINANCIAL RESOURCES.
On Tuesday the USDA surprised the grain markets again by raising the national average yields for both corn and soybeans. This sent prices sharply lower, but by the end of the session corn and soybeans had recovered about half of the losses while wheat reversed higher on the day. Part of the reason soybeans were able to trim losses could have been skepticism about the USDA's yield estimate. Let's look at why the trade might question the USDA's soybean yield.
To begin with, the trade has been expecting lower yield estimates from corn and soybeans partly based on reports from farmers but also because crop conditions have been below what we have seen in the last few years. It is important to note that the last few years have set the top three record yields. However, with the soybean crop rated at 61% good to excellent going into the September WASDE report the expectations from most analysts were for a lower soybean yield.
Recent crop tours have also noted that pod counts for soybeans are lower than what we have seen in each of the last 3 years. While the crop tours have suggested that soybeans have good potential, weather may not be ideal for soybeans to hit their potential. August was cooler than normal and September started off with well below normal temperatures and below normal precipitation. In the last 3 record setting years soybeans really enjoyed good September (even into October) weather which added to yield. So where is the USDA coming up with such a high yield estimate?
Sign up for our Morning Ag Hedge newsletter! Sign up here: http://www.zaner.com/landing/ag_hedge_newsletter.asp
The answer to the USDA's big soybean yield estimate is: Implied Pod Weight. For 2017 the USDA is using an implied pod weight of 0.340 grams per pod. This is 4% above the previous record set last year. And again, 2016 saw a fantastic finish to the growing season. The range in pod weights since 2004 is 0.268 in 2010 to 0.327 in 2016. So no other year really comes close to what the USDA is currently estimating for 2017. While it is true that pod weights tend to be higher in years that have a smaller pod count it may be difficult to get to the USDA estimate this year without an ideal finish to the growing season.
I think the best way to look at the USDA's current national average soybean yield estimate is as a measure of potential. If soybeans finish under ideal conditions we could see a national average yield at about 50 bushels an acre. However, from what I saw on the Farm Journal crop tour this bean crop has a long way to go to hit it's potential and we may not get there given the current weather forecast. We saw lots of flat pods on the eastern half of the tour and heard some of the same on the western half. Soybeans needed moisture which many areas have not gotten yet. The weather forecast is looking better, but we'll see if it comes in time.
With the strong soybean demand we have seen in recent weeks it wouldn't take much of a decline in yield to get the market excited. How many times have we seen 400 million bushel carry overs in October shrink to 200 million bushels in September because of better than expected demand. If the grain complex is going to find strength it may come from a story in the soybeans. It will be interesting to see what we get when we start cutting beans.
We have complimentary 2017 commodity reference calendars available. They are a little bigger than pocket sized and very useful if you follow markets. You can sign up for yours here - http://www.zaner.com/offers/calendar.asp (Shipping to the US only)
Give us a call if you would like more info on the strategies we are using or if you would like to set up an account to put a plan in action. Ted Seifried - (312) 277-0113. Also, feel free to give me a call or shoot me an email if you would like to talk about your marketing plan, the markets, weather, or just to visit. Follow me on twitter @thetedspread if you like.
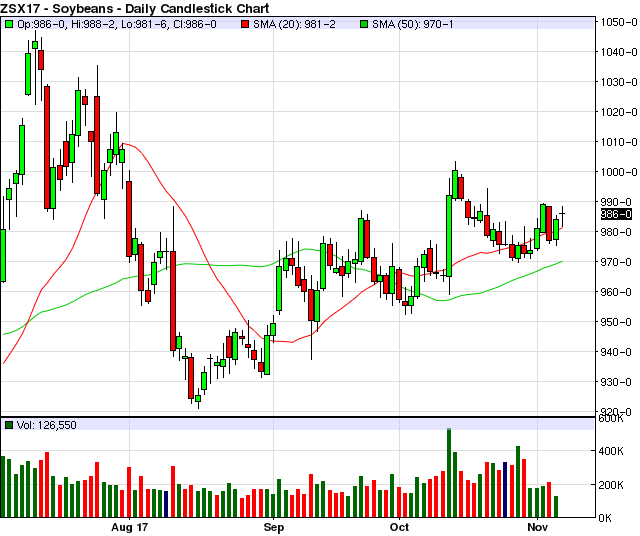
November Soybeans Daily chart:
Producers looking to hedge all or a portion of their production may be rather interested in some of the options / options-futures strategies that I am currently using.
In my mind there has to be a balance. Neither technical nor fundamental analysis alone is enough to be consistent. Please give me a call for a trade recommendation, and we can put together a trade strategy tailored to your needs. Be safe!
Ted Seifried (312) 277-0113 or tseifried@zaner.com
Additional charts, studies, and more of my commentary can be found at: http://markethead.com/2.0/free_trial.asp?ap=tseifrie
Futures, options and forex trading is speculative in nature and involves substantial risk of loss. This commentary should be conveyed as a solicitation for entry into derivitives transactions. All known news and events have already been factored into the price of the underlying commodities discussed. The limited risk characteristic of options refers to long options only; and refers to the amount of the loss, which is defined as premium paid on the option(s) plus commissions.
FOR CUSTOMERS TRADING OPTIONS, THESE FUTURES CHARTS ARE PRESENTED FOR INFORMATIONAL PURPOSES ONLY. THEY ARE INTENDED TO SHOW HOW INVESTING IN OPTIONS CAN DEPEND ON THE UNDERLYING FUTURES PRICES; SPECIFICALLY, WHETHER OR NOT AN OPTION PURCHASER IS BUYING AN IN-THE-MONEY, AT-THE-MONEY, OR OUT-OF-THE-MONEY OPTION. FURTHERMORE, THE PURCHASER WILL BE ABLE TO DETERMINE WHETHER OR NOT TO EXERCISE HIS RIGHT ON AN OPTION DEPENDING ON HOW THE OPTION'S STRIKE PRICE COMPARES TO THE UNDERLYING FUTURE'S PRICE. THE FUTURES CHARTS ARE NOT INTENDED TO IMPLY THAT OPTION PRICES MOVE IN TANDEM WITH FUTURES PRICES. IN FACT, OPTION PRICES MAY ONLY MOVE A FRACTION OF THE PRICE MOVE IN THE UNDERLYING FUTURES. IN SOME CASES, THE OPTION MAY NOT MOVE AT ALL OR EVEN MOVE IN THE OPPOSITE DIRECTION.