9/28/2017
TRADING COMMODITY FUTURES AND OPTIONS INVOLVES SUBSTANTIAL RISK OF LOSS ANDMAY NOT BE SUITABLE FOR ALL INVESTORS. YOU SHOULD CAREFULLY CONSIDER WHETHER TRADING IS SUITABLE FOR YOU IN LIGHT OF YOUR CIRCUMSTANCES, KNOWLEDGE AND FINANCIAL RESOURCES.
On Friday the USDA will release the September 1st Quarterly Grain Stocks Report. This report will, in effect, establish old crop corn and soybean carryover and new crop beginning stocks. But as we read between the lines it could have even more meaning if stocks come out much different than trade guesses, especially for soybeans.
By the time we get to the end of the marketing year we have a pretty good idea of what soybean demand has been. Exports and crush data have been collected and applied and the implied carryover has been determined. There can be small differences in 4th quarter usage and this would have a small effect on the residual category. However, if there is a big surprise in either direction it could mean that the supply side of the equation we have been using is off somewhere.
There are a few ways that the supply side estimate can be off. Planted acreage, harvested acreage and/or yield. At this point however the national average yield would be the most likely to be off by any significant margin. In this particular year, as we try to get a handle on what the current crop will yield, this could have significant market impact.
Last year we set a new record for national average soybean yield. If the stocks number were to come in much higher than expected it could suggest that yield was actually higher than the 52 bushels per acre that the USDA has reported. If this was the case it would make it easier to see how this year the soybean crop could be close (or possibly above) the 50 bushels an acre the USDA is currently estimating. On the other hand, if stocks come in much lower than expected it could make it harder to imagine that the soybean crop this year could be near 50 bushels an acre given the differences in conditions and weather.
If there is a major miss on trade expectations this Quarterly Grain Stocks report could have a big impact on the soybean market. If stocks come in close to expectations we will have to wait to get more harvest results as the market tries to get a grip on the national average yield.
We have complimentary 2017 commodity reference calendars available. They are a little bigger than pocket sized and very useful if you follow markets. You can sign up for yours here - http://www.zaner.com/offers/calendar.asp (Shipping to the US only)
Give us a call if you would like more info on the strategies we are using or if you would like to set up an account to put a plan in action. Ted Seifried - (312) 277-0113. Also, feel free to give me a call or shoot me an email if you would like to talk about your marketing plan, the markets, weather, or just to visit. Follow me on twitter @thetedspread if you like.
December Corn Daily chart:

November Soybeans Daily chart:

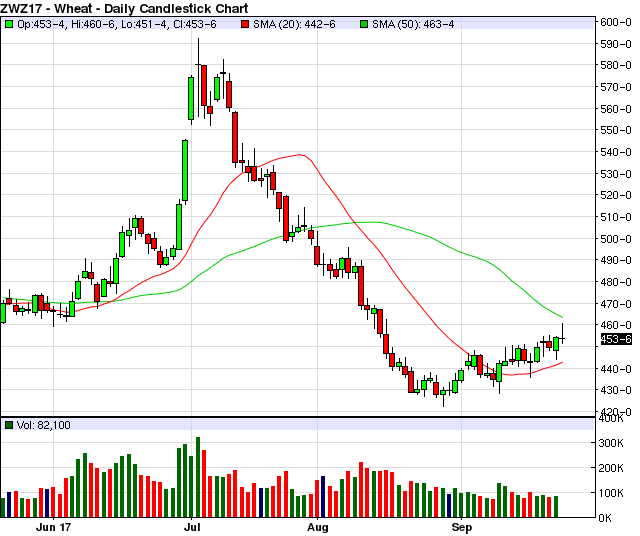
December Wheat Daily chart:

Producers looking to hedge all or a portion of their production may be rather interested in some of the options / options-futures strategies that I am currently using.
In my mind there has to be a balance. Neither technical nor fundamental analysis alone is enough to be consistent. Please give me a call for a trade recommendation, and we can put together a trade strategy tailored to your needs. Be safe!
Ted Seifried (312) 277-0113 or tseifried@zaner.com
Additional charts, studies, and more of my commentary can be found at: http://markethead.com/2.0/free_trial.asp?ap=tseifrie
Sign up for our Morning Ag Hedge newsletter! Sign up here: http://www.zaner.com/landing/ag_hedge_newsletter.asp
Futures, options and forex trading is speculative in nature and involves substantial risk of loss. This commentary should be conveyed as a solicitation for entry into derivitives transactions. All known news and events have already been factored into the price of the underlying commodities discussed. The limited risk characteristic of options refers to long options only; and refers to the amount of the loss, which is defined as premium paid on the option(s) plus commissions.
FOR CUSTOMERS TRADING OPTIONS, THESE FUTURES CHARTS ARE PRESENTED FOR INFORMATIONAL PURPOSES ONLY. THEY ARE INTENDED TO SHOW HOW INVESTING IN OPTIONS CAN DEPEND ON THE UNDERLYING FUTURES PRICES; SPECIFICALLY, WHETHER OR NOT AN OPTION PURCHASER IS BUYING AN IN-THE-MONEY, AT-THE-MONEY, OR OUT-OF-THE-MONEY OPTION. FURTHERMORE, THE PURCHASER WILL BE ABLE TO DETERMINE WHETHER OR NOT TO EXERCISE HIS RIGHT ON AN OPTION DEPENDING ON HOW THE OPTION'S STRIKE PRICE COMPARES TO THE UNDERLYING FUTURE'S PRICE. THE FUTURES CHARTS ARE NOT INTENDED TO IMPLY THAT OPTION PRICES MOVE IN TANDEM WITH FUTURES PRICES. IN FACT, OPTION PRICES MAY ONLY MOVE A FRACTION OF THE PRICE MOVE IN THE UNDERLYING FUTURES. IN SOME CASES, THE OPTION MAY NOT MOVE AT ALL OR EVEN MOVE IN THE OPPOSITE DIRECTION.